
QuickBooks (QB) is an application that assists businesses with bookkeeping, payroll, inventory control, accounting, and other financial functions. QuickBooks reporting tools allows you to create financial statements and reports.
To help automate routine tasks and save time on paperwork and bookkeeping, QuickBooks acts as the one-stop solution that aids and helps with all these purposes.
However, QuickBooks also offers ready-to-use templates for creating spreadsheets, business plans, invoicing, and charts. It can save business owners time and effort by automatically signing business checks (which are scanned and uploaded for use). QB’s connectivity with other apps also has other benefits.
Consequently, QuickBooks offers various tools for organizing and producing reports.
What Are QuickBooks Reporting Tools?
QuickBooks reporting is an accounting program that can assist your company in accomplishing all of these goals. You can create using QuickBooks to monitor and manage your company’s earnings and outlays.
Another feature of this tool is that it can provide owners, managers, accountants, and other users with the data they need to operate the business more effectively. Due to the QuickBooks Online software, creating reports is now simpler than ever for QuickBooks users, making daily tasks more effective and efficient.
QuickBooks reporting tools come in various forms. The most popular are financial reports, which display an organization’s overall economic health. Balance sheet reports display a company’s assets, liabilities, and equity, while income statement reports record a company’s revenue and expenses. Additionally, QuickBooks provides job status reports, vendor and customer information, and inventory data. Reporting is the primary method by which QuickBooks users obtain the financial information of their business.
The types of financial reports are as follows:
- Transaction reports: These provide specifics about the transactions that have taken place in QuickBooks.
- List reports: A QuickBooks list report shows a graph or chart with relevant data.
- QuickBooks summary reports: This report provides an overview of the transactions for specific accounts in QuickBooks.
- Detail reports: You can access the QuickBooks detail report under Advanced Customization to monitor particular transactions from many QuickBooks accounts.
What are various QuickBooks Reporting Tools?
QuickBooks (QB) is an accounting program developed by Intuit that offers several tools to streamline your accounting procedures, including:
- Payroll
- Inventory control
- Billing
- Accounting
- Tax management
QuickBooks reporting features improve these operations. They assist companies in creating thorough reports that offer information on output and performance. Excel and specialist reporting software are examples of these tools.
Let’s discuss the benefits of using QB for reporting and how reporting features enhance your accounting program.
Why is QuickBooks used for reporting?
You should use QuickBooks for your reporting instead of spreadsheets for several reasons.
- Reports are first and foremost for illustrating and evaluating your company’s success.
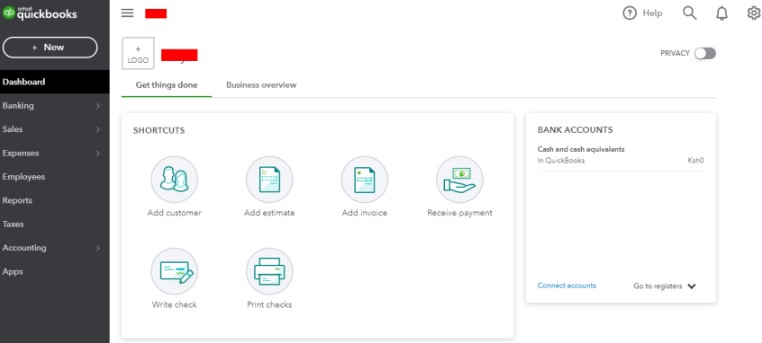
- Also, QuickBooks reports simplify comparing previous and present performance to understand your company’s condition thoroughly. You have access to user-friendly dashboards that show you your
- Transactions
- Bills
- Accounts
- Additionally, QuickBooks reporting tools make tracking sales expenses and earnings even more straightforward. These technologies apply to a wide range of businesses and their practices, from retail, where inventory management is the primary focus, to field service, where accounting centers around time tracking.
- For forecasting, a lot of companies use QuickBooks reporting features. Others utilize them to make data interpretation easier with QuickBooks’ visual reports. Whatever your motivation for selecting these tools, you will undoubtedly experience several advantages.
Now that we understand these QuickBooks reporting tools better let’s examine their advantages. Therefore, let’s examine them below:
Benefits of using these QuickBooks Reporting Tools
QuickBooks reporting features allow you to expand the services you provide to your clients and enhance how you manage your vendors and consumers.
Accurate QuickBooks reporting tools benefit everyone, including:
- Small companies
- Contractors
- Self-employed people
For QB Desktop users, reporting features offer several advantages.
Distinctive business report
Key financial data in QuickBooks reports can be compiled using QuickBooks reporting tools. QuickBooks Desktop has several pre-made report templates that you can alter to suit the particular needs of your business.
This suggests that you can personalize your reports to show the most essential information, such as statements of profits and losses, cash flow statements, and more.
For instance, if you run a manufacturing company, you may tailor your reports to show essential data like assembly efficiency and inventory waste. Watch this webinar with industry professionals to learn more about the advantages of QuickBooks reporting tools for manufacturing.
Adaptive usage
No two businesses create reports in the same manner. The versatility of QB Desktop reporting is one advantage. You can have complete data freedom with QuickBooks Desktop by:
- Displaying just pertinent information.
- Arranging data according to your current needs.
- Combining data into summaries for simple analysis.
- Examining reports in advance of completion.
- Modifying the metrics to reflect the information.
Reports from QuickBooks Desktop can also be exported to various formats.
Creation of reports
Making reports with QuickBooks Desktop is easy, mainly if you use the additional reporting capabilities and integrations.
While you can build reports from scratch, you may save time and get started immediately by using QuickBooks’ pre-made templates.
Even better, you can format QuickBooks reports to meet particular presentation requirements by using extra tools.
Using external software, you can access extra templates and capabilities that improve your reporting projects and offer helpful analytics.
Now, let’s examine the various QuickBooks reporting options.
Types of QuickBooks reporting options
You may choose your company’s finest QuickBooks reporting solution by evaluating the various alternatives available.
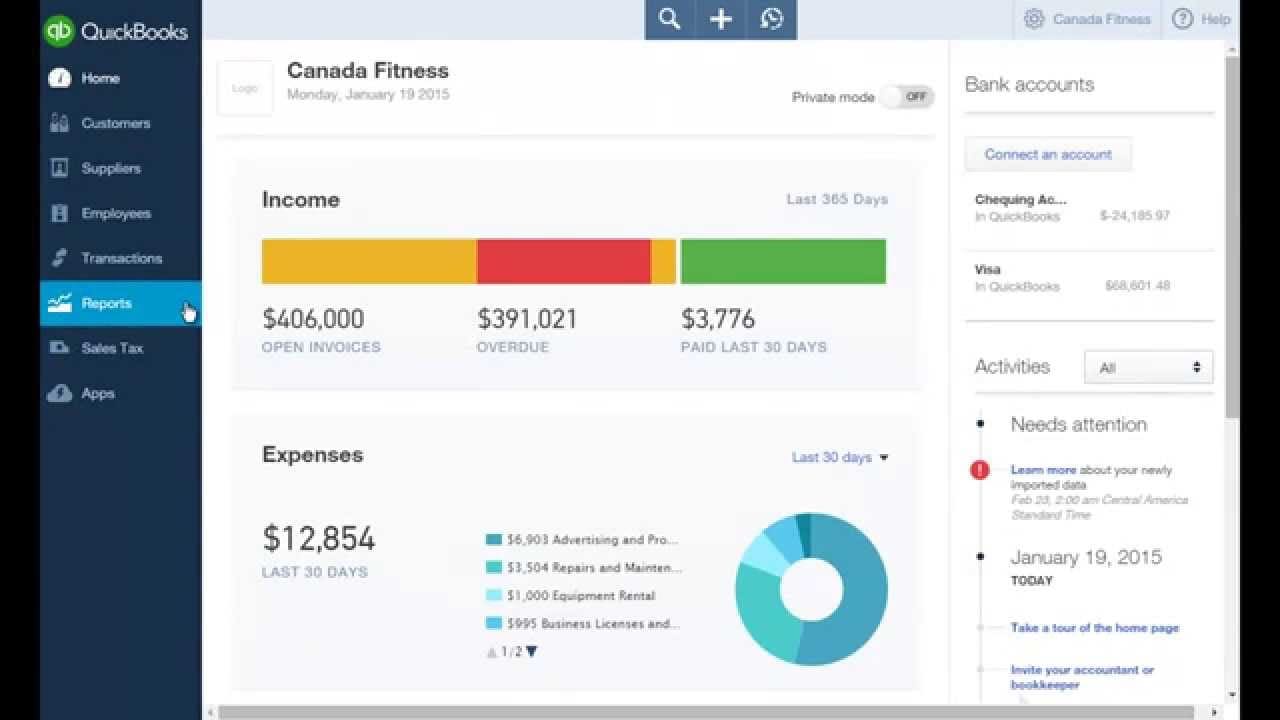
- If you’re a visual thinker, you can visualize patterns and trends in QuickBooks reports with the help of QuickBooks reporting tools. For instance, you should search for tools that enable you to visually present financial data using QuickBooks graphs if your goal is to forecast your company’s future.
- Organization is another aspect of reporting. You should understand how to manage and arrange reports with QuickBooks reporting capabilities and filter data in reports according to specific criteria. In this manner, you should always look at current and pertinent data.
- Lastly, you must be able to exchange reports, mainly when working with others. It is crucial for collaboration to share QuickBooks reports with team members and, if necessary, have a mechanism to share them with stakeholders.
Let’s turn our attention to QuickBooks Online now.
QuickBooks online reporting
QuickBooks Online is the most popular version. Thus, the platform is supported by several tools, particularly in reporting.
How to begin using reports with QuickBooks Online?
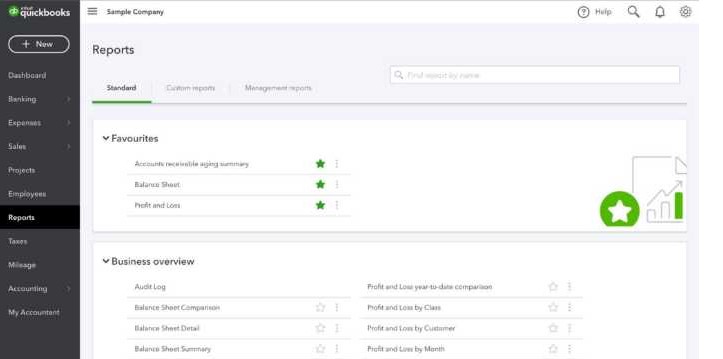
To begin using QuickBooks Online reporting, follow these steps:
- Open your QBO account and log in.
- From the left menu, select the “Reports” tab. This will direct you to the Reports Center.
- Examine the usual reports that come with your subscription to QuickBooks Online.
- Click on the name of the report that you have chosen to open it.
- Use the customization options at the top to improve your data and include more information in your reports.
Advanced features or attributes in QuickBooks online
Take a look at these features QuickBooks Online provides to elevate your reports:
Memorize reports:
If you want to use reports you’ve created as templates in the future without having to make changes each time, you may memorize them in QuickBooks.
Budgeting:
QuickBooks Online allows you to create business budgets and compare actual performance to projected amounts by making budget reports.
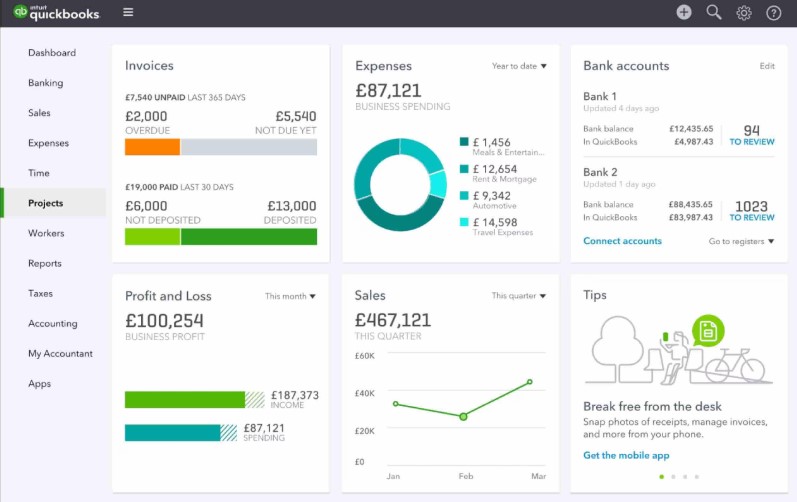
Customized charts and graphs:
Create charts and graphs that summarize your data in an understandable visual format.
Comparative reports:
It allows you to compare data from various periods, enabling you to spot shifts in your company’s financial performance over time.
Reports that are available in QuickBooks online
QuickBooks Online has a large number of pre-built reports accessible. Among the most widely utilized ones are:
Transaction detail reports:
Emphasize invoices, payments, and other information.
A balance sheet report:
It shows you how profitable your company was at a particular moment in time.
A cash flow report:
It display the amount of money arriving in and leaving the company.
Reports and financial statements
Financial reports and statements are crucial to comprehend your company’s performance and economic health. Let’s examine how to make them.
Making financial reports and statements from the beginning
Financial statements can always be made from the ground up. Due to this, you have complete control over the content and appearance of your statements.
To save time, storing your initial statement as a template for later usage is a good idea, even if you create it from scratch.
Modifying pre-existing QuickBooks Online reports
Templates are the most effective method for creating financial reports with QuickBooks reporting capabilities. The most effective method for creating thorough reports in QBO is to modify the pre-made report templates.
Additionally, you can add features to these pre-made reports using QuickBooks reporting tools. Among the examples are:
- Including logos.
- Unique fields.
- Other color schemes.
Using pivot tables to create intricate reports in QuickBooks Desktop Pro or Enterprise
If you want to do more complex data analysis, pivot tables are a great choice. You can make complex reports using QB Enterprise and Desktop Pro pivot tables.
Remember that QuickBooks does not allow you to create pivot tables directly. You must export your data from QB and generate the pivot tables using Google Sheets or Microsoft Excel.
Presentation-ready documents and report templates
In QuickBooks, creating reports from scratch might be difficult. Fortunately, you can quickly produce reports suitable for presentations with access to templates & QuickBooks reporting tools.
Saving time by using pre-made report templates
The pre-made templates offered by the platform are among the most significant aspects of QuickBooks reporting. Utilizing these templates, you
- Conserve time
- Reduce expenses
- Keep your graphics consistent
But it takes more effort to turn these reports into presentations.
Using Excel report data to create polished, presentation-ready materials
You should turn your reports into a visual story for presentations. QuickBooks reporting tools are helpful in this situation. For instance, use these procedures to create presentation-ready documents in Excel using data from QuickBooks reports:
- QuickBooks data can be exported to Excel.
- Use Excel to format and arrange the data.
- After this, use Excel’s charting capabilities to create visually appealing charts and graphs.
- Use presentation software like PowerPoint to make presentations and incorporate your charts.
- Examine, modify, store, and distribute.
Understanding business performance and making well-informed decisions
The reporting goals are to learn about your company and identify more effective ways to operate it. Built-in reports from QuickBooks or other integrated reporting applications further enhance your insights. Such as:
Using integrated reporting to monitor company performance
One of the most significant features available in QuickBooks is built-in reporting. These reports can be used to:
- Monitor the performance of your company.
- Keep an eye on your financial situation.
- Make wise choices.
With the abundance of new information available, choosing the best QuickBooks reporting tools for your company is the only remaining task.
Use Method to personalize your QuickBooks reports
The most excellent tool for producing tailored reports for particular business requirements is Method. It can be challenging to figure out how to alter the report layout in QuickBooks. Fortunately, Method’s limitless flexibility allows you total control.
The method is the most effective QuickBooks reporting solution because it is automated. To create your reports, you can import data from QuickBooks into Method using a patented two-way sync. Don’t worry —you can preview reports in QuickBooks before completing them.
Conclusion
This information helped you navigate the web or desktop versions of QuickBooks reporting tools. The article above explains that users can choose based on their needs, and the report will be available in minutes.
As a result, after reading this post, your previous queries might be addressed successfully. But don’t worry if you still require assistance; our QuickBooks desktop support team can help you with any questions or issues.